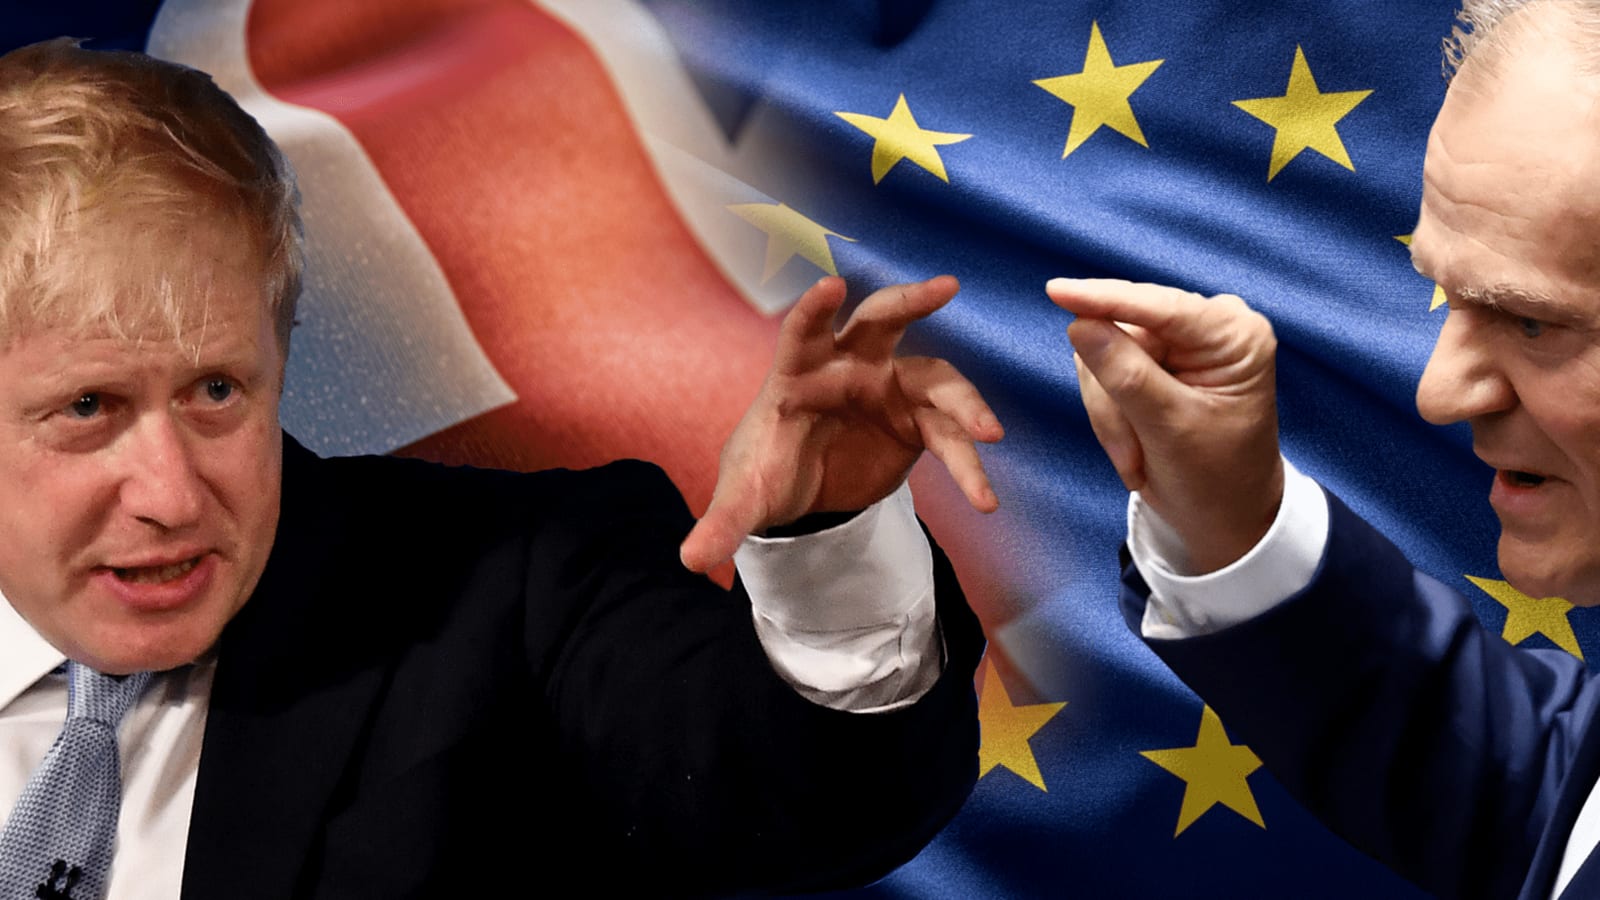
CNBC is marking ten years since the Brexit referendum with a fresh set of charts that track how the U.K. has changed across growth, immigration, sterling, trade and politics. Published on June 23, 2026, the package pulls together economic and political data into a single visual snapshot of the country a decade after the vote to leave the European Union.
The timing matters. With questions still swirling over the costs and gains of Brexit, the CNBC charts aim to show where the U.K. has diverged, where it has held steady, and how those shifts feed directly into everyday debates about jobs, prices, borders and who runs the country.
Key facts
- Source
- CNBC
- Reported
- June 23, 2026
- Desk
- general
- Follow the story
- Spinn Radio Talk
How CNBC’s Brexit-at-10 charts frame the UK story
CNBC’s latest package approaches the Brexit anniversary as a data story first. By lining up charts on growth, immigration, sterling, trade and politics, it treats the past decade less as a series of slogans and more as a set of trends that can be compared over time. For readers and investors trying to separate signal from noise, the value is in seeing these big themes next to each other rather than in isolation.
Growth, migration, currency moves and voting patterns have all been argued over since 2016, often with competing claims about what actually changed. The CNBC charts, reported on June 23, 2026, are an attempt to pin those claims to numbers, showing how the U.K. economy and political landscape have evolved since the Brexit vote itself.
For anyone following the story in real time, the data-driven angle is a reminder that Brexit is not just a one-off event but an ongoing adjustment that still shapes policy fights in Westminster and choices in households and boardrooms.
“The CNBC charts treat the past decade less as a series of slogans and more as a set of trends that can be compared over time.”
UK growth since Brexit: what the charts are asking
One of the core strands in CNBC’s work is growth: how the U.K. economy has performed in the ten years since the referendum. By highlighting growth data over that period, the charts are implicitly asking how the country’s trajectory has changed under a new trading and regulatory setup compared with the pre-Brexit era.
The focus on growth matters because it underpins everything from wage packets to public spending. A decade after the vote, the key question for readers of the CNBC package is not only how much the U.K. economy has expanded, but how that pattern lines up with the shocks of Brexit itself and the political choices that followed.
These growth visuals are likely to be pored over by businesses deciding where to invest next and by voters weighing whether the economic story they were promised in 2016 has materialised.
Spinn Radio
Follow live news on Spinn Radio
Immigration and trade: Brexit promises under the microscope
By putting immigration and trade in the same visual frame, CNBC is drilling into two of the most contested promises of the Brexit campaign. The immigration charts speak to one of the defining arguments of the 2016 vote: control over who can live and work in the U.K. Ten years on, the data offers a structured way to see how patterns of movement have shifted since the country left the EU framework.
Trade charts perform a similar function. They show how cross-border flows of goods and possibly services have changed in the years after new trading rules took hold, and invite readers to compare those trends with the pre-referendum status quo. For exporters, importers and workers in trade-heavy regions, these visuals go straight to the question of how Brexit has reshaped the U.K.’s economic ties with the rest of the world.
Together, immigration and trade form a test of Brexit’s core economic and social claims. The CNBC charts do not settle the political arguments on their own, but they give viewers a baseline from which to judge new policy proposals or fresh promises from party leaders.
“Immigration and trade sit at the heart of CNBC’s package because they sit at the heart of what Brexit was supposed to change.”
Sterling and politics: reading the mood through markets and votes
CNBC’s decision to chart sterling alongside politics links two arenas that have tracked each other closely since the referendum night market swings of 2016. Currency charts can show how investors have periodically reassessed the U.K.’s prospects as negotiations unfolded, governments changed and new policies landed. Political charts, in turn, capture how voters have responded at the ballot box as the costs and benefits of Brexit have filtered through daily life.
By anchoring politics in data, the CNBC package invites readers to see whether support for different parties or positions has shifted over the decade and how those shifts line up with big Brexit-related milestones. Combined with sterling’s path, the visuals hint at how both international markets and domestic voters have priced in the country’s new relationship with Europe.
For politically engaged listeners who track both polls and prices, these charts are a way to see the mood of the country twice over: once through elections and once through the currency that reflects external confidence.
What to watch next and where to follow the debate
The publication of CNBC’s Brexit-at-10 charts on June 23, 2026, is not an endpoint. It sets up the next round of arguments over what the numbers show and what should happen now. The key things to watch are how politicians cite these visuals to justify their policies, how businesses respond to the picture on growth and trade, and whether new data in the coming years confirms or challenges the decade-long trends.
For readers who want more than a static snapshot, the conversation will keep moving through news, interviews and call-ins. You can Follow live news and talk on Spinn Radio to hear how economists, campaigners and listeners themselves react to the CNBC findings and set out their own priorities for the next ten years.
As the U.K. continues to adjust to life outside the EU, these charts are likely to resurface whenever fresh elections, trade talks or immigration reforms push Brexit back to the top of the agenda. Spinn Radio will keep tracking how the data and the politics collide, and what it means for people living with the consequences every day.
“The CNBC charts are a snapshot; the real story is how politicians, markets and voters respond to what those lines on the page now show.”
Good to know
Frequently asked questions
What has CNBC published about the UK a decade after Brexit?
CNBC has published a set of charts showing how the UK has changed across growth, immigration, sterling, trade and politics ten years after the Brexit vote. The package, reported on June 23, 2026, pulls together economic and political data into a single visual overview.
Why do these new UK charts from CNBC matter now?
The new charts matter because they arrive exactly a decade after the Brexit referendum, when debates over its costs and benefits are still live. They give readers a data-driven way to judge how the UK economy and politics have shifted since 2016.
What topics do the UK Brexit anniversary charts cover?
The charts cover five main areas: growth, immigration, sterling, trade and politics. CNBC uses these themes to frame how Brexit has affected everyday life and national strategy.
Where can I follow ongoing debate about the UK economy and politics?
You can follow ongoing debate by tuning into live news and discussion on Spinn Radio Talk. Start at our news hub here: Follow live news and talk on Spinn Radio.
Explore more on Spinn Radio: Follow live news and talk on Spinn Radio
Sources